
Michael Fagin looks at the weather trends in Walla Walla and how climate change might impact wine production in the future.
After a four hour drive over the Cascades Mountains, coming from Seattle, you arrive to Walla Walla passing Washington’s other wine regions of Yakima, Tri-Cites (Richland-Hanford-Pasco), and Prosser. Surrounded by mountains, this is the dry part of Washington state which makes it an ideal spot for vine growing.
Parts of Walla Walla have desert-like conditions with just 170 mm of rain a year. However, there are many areas near the foothills of the Blue Mountains that get closer to 560 mm. Fortunately, much of the precipitation is in winter so there are no mildew issues during the growing season (April to October) and generally a good supply of water.
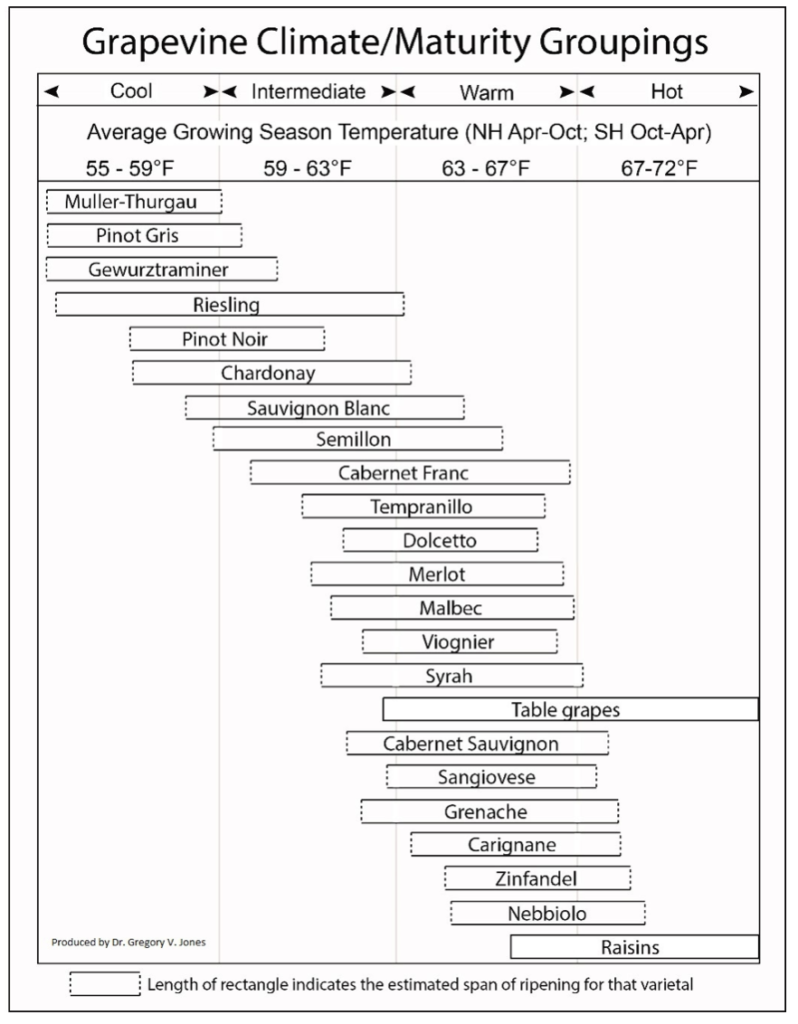
Summer brings great growing conditions in Walla Walla. Because it is so far north the region gets over 15 hours of sunlight and average growing season temperatures of 17.2 C which is the sweet spot for Cabernet Sauvignon production.
Revisiting the historical climate of Walla Walla
While chatting with winemakers and vineyard managers I always ask about weather trends and impacts on their grapes. More often than not I get a response of: “weather patterns seem extreme every season.” I decided to take the scientific approach and look at some historic weather data.
The goal is to find official weather stations within the Walla Walla AVA that have a long record of weather data. We picked the Walla Walla Airport and Milton-Freewater, Oregon, which is 22 miles south of Walla Walla town and in The Rocks AVA, which is part of the Walla Walla AVA. We also used a relatively new site in Walla Walla, the Ag. Met station. The data we reviewed and all the graphs can be found here.
The goal is to review key weather trends since 1949 and some cases since 1928. We are looking at these weather variables: yearly temperature trends, temperature trends during growing season (April through October), yearly precipitation trends, changes in frost free days, looking at changes in extreme conditions- days over 100 F (38 C) and days under 32 F (0 C).
Temperature trends growing season
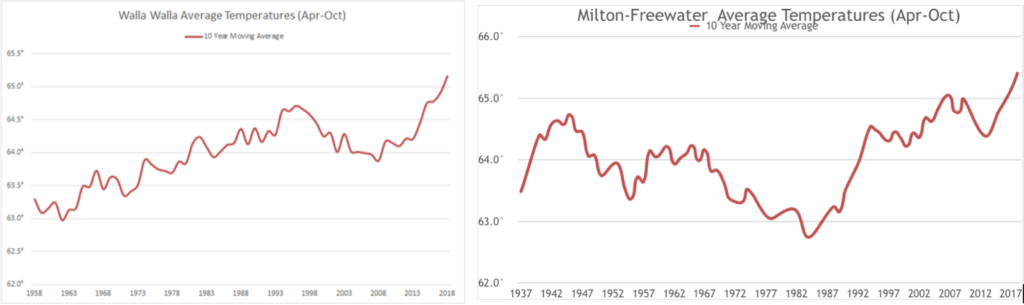
In Milton-Freewater, the mean temperature for the April to October growing season has risen 1.2 to 1.8 C since 1928, with more recent years averaging around 18 C. The lowest recorded mean temperatures haven’t dipped lower than 16 C. In the next few years, the mean temperature may surpass the past ninety years of records. Walla Walla has shown similar trends in terms of a steady increase.
Frost Free Days in Walla Walla
Walla Walla Ag. Met station over the past 25 years annual count of frost-free days has declined in the late-1990s but has more than rebounded since the mid-2010s, climbing over 240. The count of frost-free days is a meteorological parameter for measuring the length of a growth season.
Growing Degree Days in Walla Walla
When determining whether a particular crop will grow in a particular area, agriculturalists use a heat index known as Growing Degree Days or GGD. The GGD units are calculated by a formula that subtracts that specific crop’s reference temperature from the daily mean temperature of the area. This formula provides a GGD number for the region. In our data we used 50 degrees Fahrenheit as the base.
Despite a slight decline since three years ago, the count of growing degree days at the Walla Walla Ag Met site from 2008-2017 has steadily increased with an average of 2,794.
The Milton-Freewater station, has, on average, been increasing slightly over the past ninety years, up around 500. The Walla Walla station on average increased slightly from 1949-2017, up around 300.
Days at or below 32 F (0 C)
At Walla Walla the count of days at or below freezing from 1947-2017 has declined sharply, especially since the late-1990s, with most years seeing none. Before then, two to 13 frozen days were typical and years seeing none were much more uncommon. In Milton-Freewater, the count of days at or below freezing over the past ninety years has declined sharply, especially since the late-1990s, with most years seeing none. Before then, two to 14 frozen days were typical and years seeing none were rare.
Rainfall trends in Walla Walla
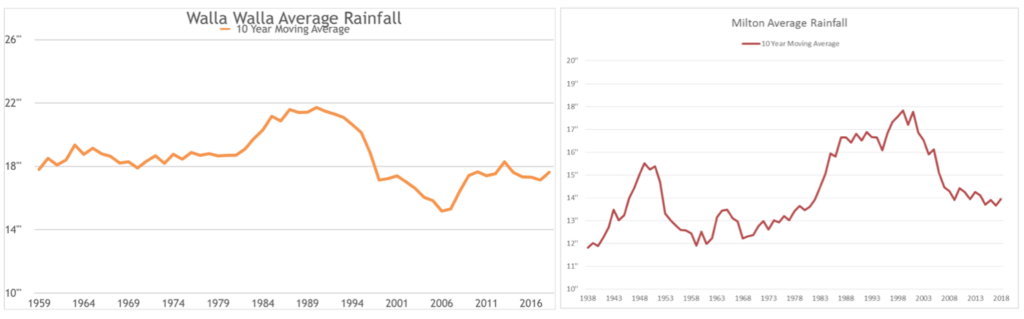
Milton-Freewater’s average rainfall has risen since the late-1930s, but the spread of the data makes it difficult to accurately define a true trend. There was around 76 mm more rainfall in the mid-1980s to early-2000s comparatively, but the late-2000s to present day has consistently been only an 25 mm higher than the pre-1980s average.
Walla Walla average rainfall since 1959 tells a different story from Milton-Freewater. While the average also rose around 76 mm in the mid-1980s, it fell sharply in the late-1990s to around 51 mm lower than the consistent pre-mid-1980s average of 457 to 483 mm. Other than a slight decline in the 2000s, an average of around 445 mm has been maintained.
Future trends and what climate change in Walla Walla means for wine
All studies are suggesting additional increases in temperatures from now till 2100. In fact a recent study suggests by 2040 Northern California premium wines will be greatly impacted. Global warming could alter U.S. premium wine industry within 30 years; Stanford scientists say. However some think this is extreme and only time will tell.
For climate change, most experts look at temperature trends since 1880. Best estimates are that worldwide temperatures have increased about 0.8 C since 1880.
The recent report by the UN Intergovernmental Panel on Climate Change (IPCC) suggests that unless major changes are implemented to reduce greenhouse emissions temperatures will continue to increase, even as much as 3 C by 2100. We have 12 years to limit climate change catastrophe, warns The Guardian.
An upward trend in temperatures and plantings
The million dollar question is what temperature trends can Walla Walla area expect? If we take the data from Milton-Freewater the temperature increased close 1.2 C over the last 80 years. Walla Walla has had a similar increase over the last 60 years. So if we assume over the next 80 years we are looking at an additional increase of 1.2 C. Thus the average temperature for the growing season increases from the current estimate of 18 C to 19 C by 2100. This temperature is well within the range for Cabernet Sauvignon, which is good news for any producers of this popular variety!
However, some climate experts would expect greater temperature increases than we have listed and many significant impacts beyond just our wine regions.
Fortunately water is in good supply in Walla Walla however winemakers are beginning to make adjustments for higher temperatures – managing the canopy climate and vineyard management systems.
The wine industry is also already making adjustments by planting at cooler locations on north facing hills and at higher elevations, likely a trend set to continue in the future.
Guest post by Michael Fagin

Michael is a freelance wine writer and meteorologist who travels different wine regions around the US with his wife, and fellow wine writer, Elizabeth. He is operational meteorologist for West Coast Weather and provides weather forecasts for the U.S. West Coast which includes agricultural forecasts for some of the major wine regions in California and Oregon. He was attending Walla Walla recently for the Wine Bloggers Conference.
Main photo of Walla Walla by Richard Duval, Walla Walla Wine Alliance
Take a look at some of our winemaker interviews from Washington to get their perspective on the region:
Other guides to Washington wines: